Activate python environment that you have already setup by typing p3.
Make sure all beamline EPICS IOCs should be up and running before using the scanning tool.
The scanning tool directory is located in the home directory of the control user. To access it:
$ cd ~
$ cd MS-XPD-ScanTool
$ python main.py
The main function will validate and execute some procedures and functions, if all is fine GUI will appear:
Figure 1: First popup that allows you to choose experiment type
Warning
In case if the scanning tool does not start:
if one of UI PVs is disconnected, the scanning tool will show, in the main terminal, an error message in “red” color (“Scanning IOC is not running!!”).
if UI path does not exist, the scanning tool will show, in the main terminal, an error message in “red” color (“Can’t start the scanning tool!”).
trying to start the scanning tool if it has already started, the scanning tool will show, in the main terminal, an error message in “red” color (“Can’t start DAQ tool, the DAQ system is already running”).
From the GUI above you can choose the experiment type:
A. Choose Users Experiment if there is a scheduled beamtime for an accepted proposal.
Upon choosing Users Experiment, you will be asked to provide scheduled proposal ID as shown in figure.2 below:
By choosing “Users Experiment”, the scan tool will:
validate whether the provided proposal number is correct and valid for this beam time.
if the validation result is okay, the scanning tool will import the proposal metadata and include them in the experimental file. If not, user will be alerted and the tool will not be able to continue!!
Note
The scanning tool is already integrated with the users database. All validation and metadata importing processes are done through such integration. metadata of a validated proposal includes but not limited to proposal title, principal investigator information, number of allocated shifts, proposal review committee.
Note
Note: During the final night shift of the accepted proposal (after 12:00 AM), you may encounter an error message even if the correct proposal number is entered. Don’t worry—simply confirm that you are aware of this issue.
B. Choose Local Experiment to run in-house experiment that is not associated with a proposal.
This scan mode is intended to run “not proposal based” experiments, example of such experiments:
Director general beamtime.
In-house research experiment.
Testing / commissioning new components at the Beamline.
Warning
Normally, this option is restricted to beamline scientists.
Warning
Access to experimental data generated out of this kind of experiment is restricted to beamline scientists and authorized SESAME staff only. On the other hand, the generated data will not be mapped/linked with any proposal or PI work.
The scanning tool offers four scan modes as shown in figure.3:
By choosing one of the scan modes, you have the option either create a configuration file and thus generate a new configuration file or load an already existed configuration file.
Figure 4: Configuration mode choosing GUI, either to create new config file or load already existed one
Warning
In the second option (load configuration file) is chosen, you have to make sure that:
the configuration file should be ended with “.config” extension.
the loaded configuration file should be corresponded with chosen scan mode.
the configuration file format is JSON format, if the file or one of the above conditions is not correct, you will be alerted.
Next GUI is meant to enter new experiment configurations or see/edit a loaded one, based on the chosen scan mode.
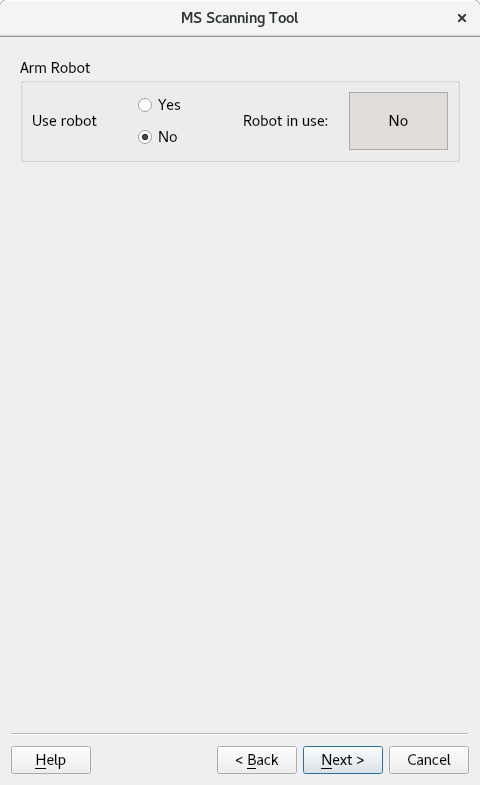
The next step after creating or loading the configuration file is to decide whether to use an arm robot.
Note
The arm robot is only supported for these scan modes: TwoTheta Step Scan and TwoTheta Step Scan with Slits Configurations.
Use Robot: The DAQ system offers an Arm Robot, it has been designed to handle the samples in a container that holds up to 40 samples.
Figure 5: Using robot GUI
By choosing Yes, you will see/edit the main experiment parameters GUI for robot use.
Figure 6: Main experiment parameters (TwoTheta Step Scan Using Robot)
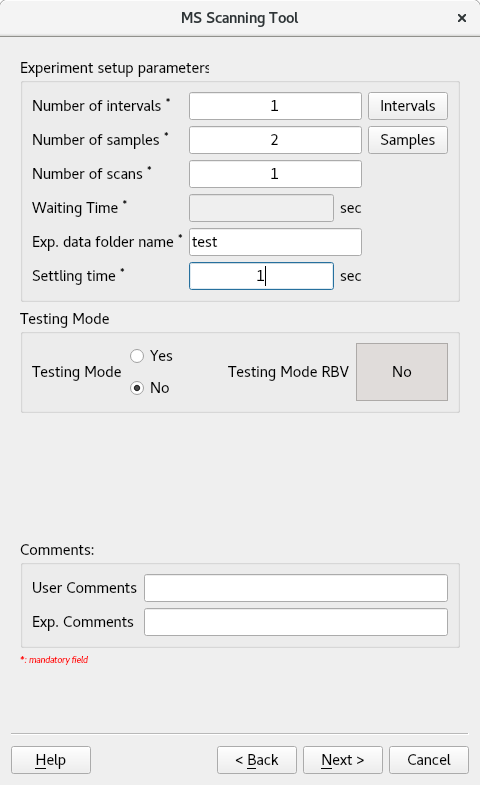
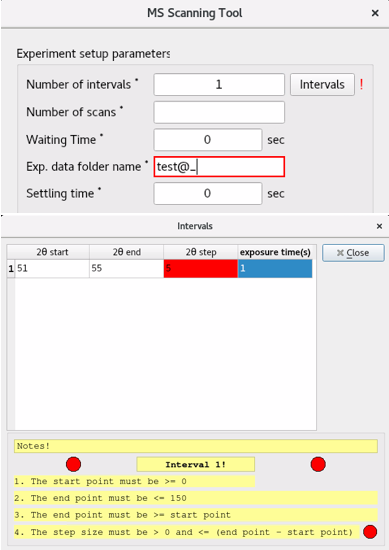
The user can enter many intervals, each interval has diffractometer start angle(deg), end angle(deg), step size, and Pilatus detector exposure time(s).
If ‘1’ is entered, pressing the ‘Intervals’ button will open a new window prompting you to specify the 2θ range intended for measurement. Note: The Pilatus 300K detector attached to the diffractometer covers ±3 degrees from its center, so this must be considered. For example, if you want to measure from 2θ = 5 degrees, you should enter 8 as the 2θ start value.
The DAQ System checks the user inputs parameters instantly, and emits warning indications (red borders, red background, red flash LEDs, and exclamation marks) for incorrect inputs.
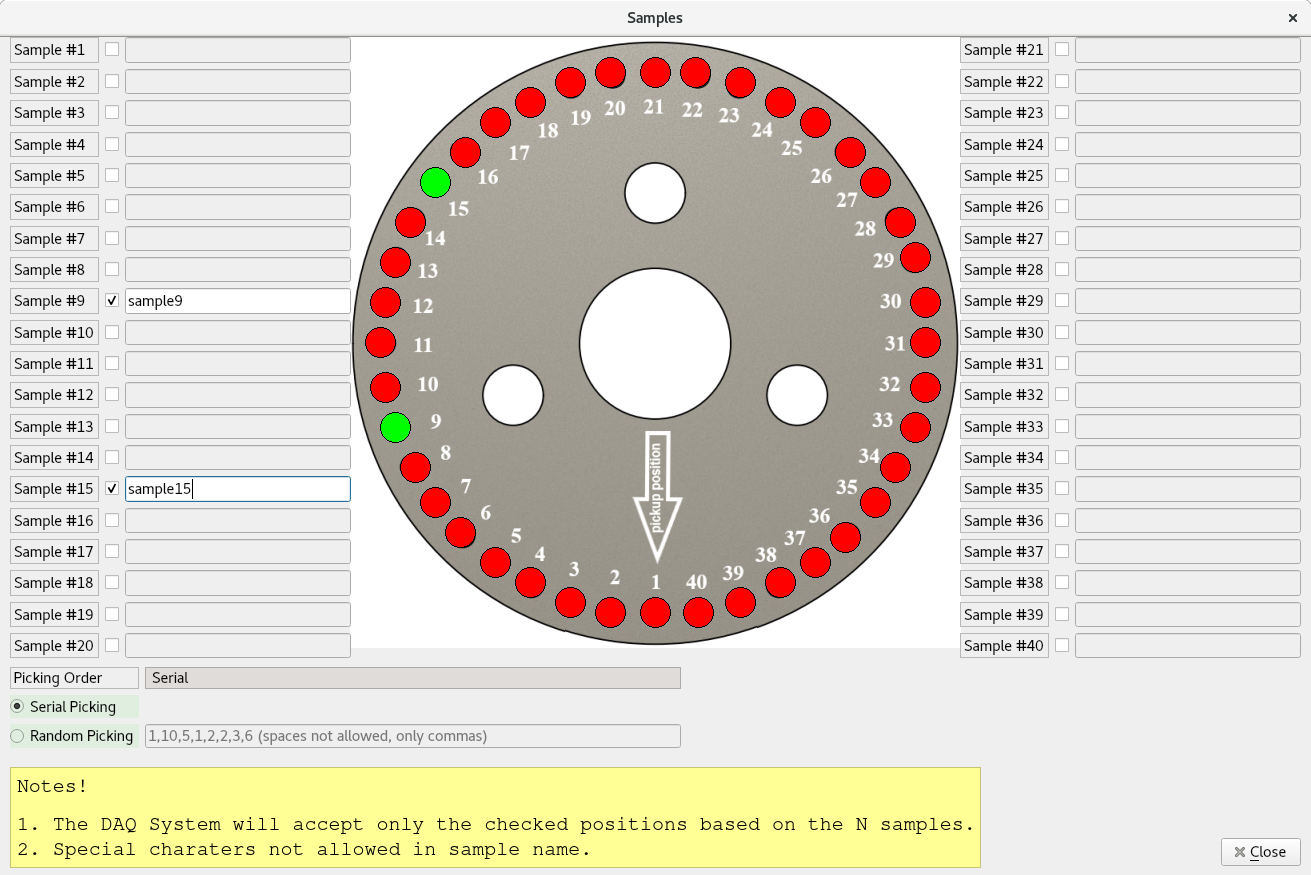
The user can define many samples and align them with respect to the container (depending on the number of samples are being defined). Through this GUI, the user can select the pickup positions and define the picking order either serial (ascending sampling) or random (user defined pattern based on elected positions). Also, for each sample you must assign name where it will be used as part of the experimental file name.
Holding the cursor over the input fields emits an info tool tip.
Note
Testing mode allows you to start a scan regardless the shutters status.
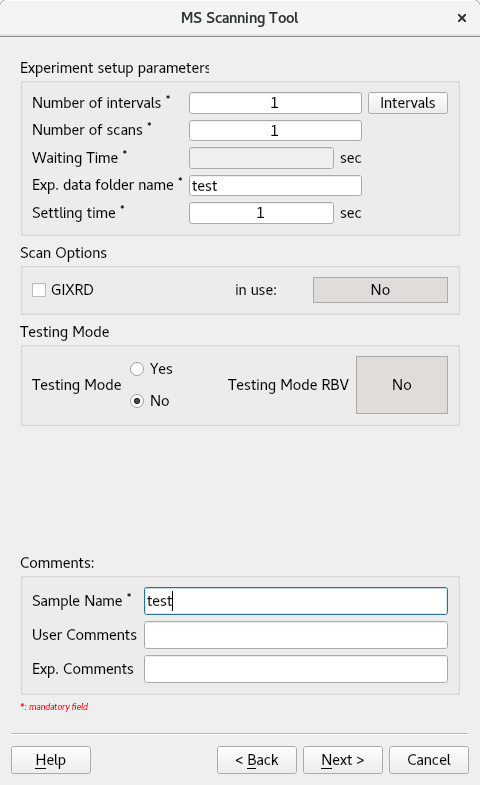
Without Use Robot: In case of proceeding without using robot, the main experiment parameters GUI will be as figure.10, the default NSamples is 1.
One of the scanning options for MS-XPD is GIXRD (Grazing Incidence X-ray Diffraction), which is intended for flat sample set up.
Figure 10: Main experiment parameters (TwoTheta Step Scan Without Using Robot)
By clicking “Next”, if all is fine, the last GUI will pop up as shown below:
The DAQ system also offers notifications feature, it is an email service for any new scan-related updates.
Figure 11: Last GUI before triggering the scan to start
Once scan is started, interactive logs will be printed on the main terminal showing exactly what is being processed. Also, an interactive data visualization tool UI will be started as shown below in figure.12.
This interactive UI tool is designed to make it easy to monitor the scan status, it offers many features:
Scan Status represented with interactive colors ({Running:Green, Finished:Blue, Paused:Yellow, Stopped/Terminated:Red}).
Immediate Scan Actions (Pause, Resume, Stop).
Time Parameters (Experiment start time, end time, elapsed time, and expected remaining time).
The second scan mode offered by DAQ system is TwoTheta Step Scan with Temperature. This mode allows you to start experiments by exposing the capillary samples to high temperatures (up to 1000 °C).
Following the same procedure, after creating or loading the configuration file, you will see/edit the main experiment parameters.
Figure 13: Main experiment parameters (TwoTheta Step Scan with Temperature)
The user as well can enter many intervals, twoTheta intervals and temperature intervals (start target temperature(°C), end target temperature(°C), step size, scans, and waiting/settling time(s)).
After filling the fields and clicking Finish, the interactive data visualization tool UI for this scan mode will be started as shown below in figure.15.
This scan mode offers an additional feature: a graph plot that shows the temperature changes over time.
Figure 15: Interactive data visualization GUI (TwoThetaStep Scan with Temperature Mode)